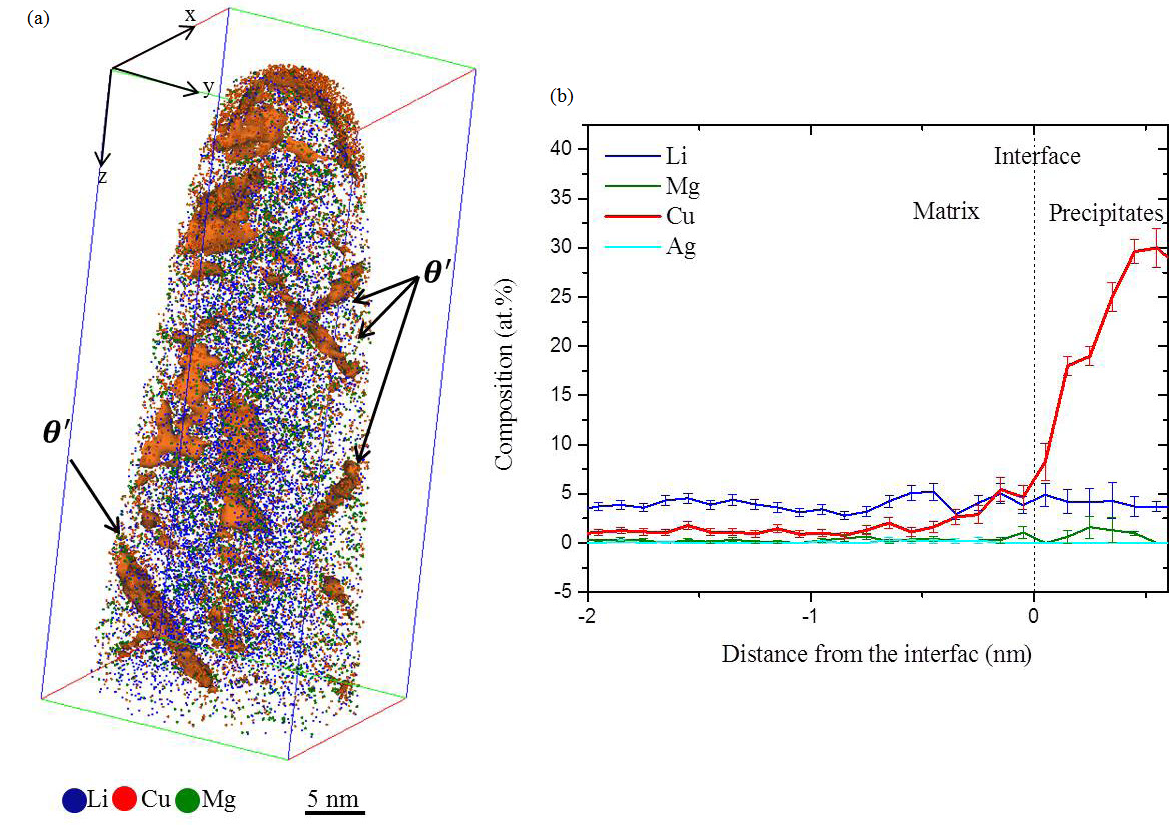
Figure 6: LAWATAP analysis of the sample following T8 heat treatment.
(a) The reconstructed volume of the sample displayed with isoconcentration surfaces of 4 at.% Cu delineate θ' precipitates.
(b) Corresponding combined proxigram composition profile based on these isoconcentration surfaces indicating a chemical composition of the θ' precipitates as (29.6 ± 1) at.% Cu, (3.2 ± 0.4) at.% Li and (1 ± 0.2) at.% Mg.