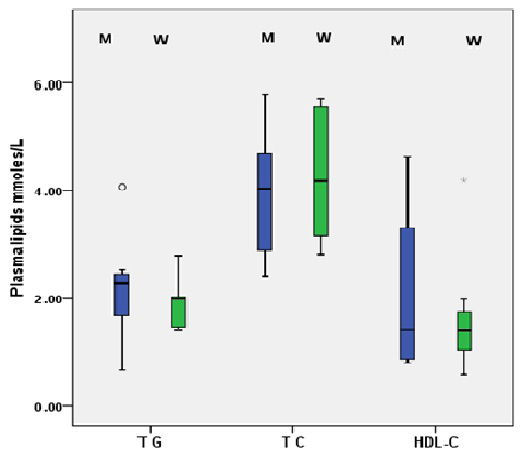
Figure 3: Serum triglyceride (TG), total cholesterol (TC) and high density lipoprotein cholesterol (HDL-C) concentrations among diabetic men and women. Boxes represent the interquartile range (IQR) and the line inside represents the median. Whiskers denote the lowest and highest values.